Demo Dashboards
Small Changes-Big Profits
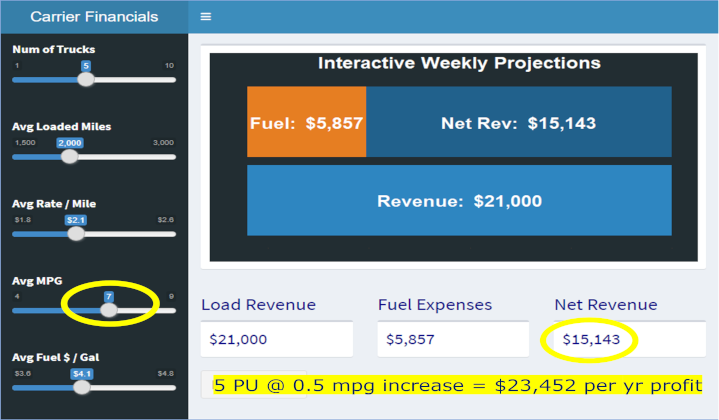
Small operational changes can boost net revenues substantially. See how even 0.5 mpg improvement in fuel efficiency can save tens of thousands of dollars annually.
Watch Video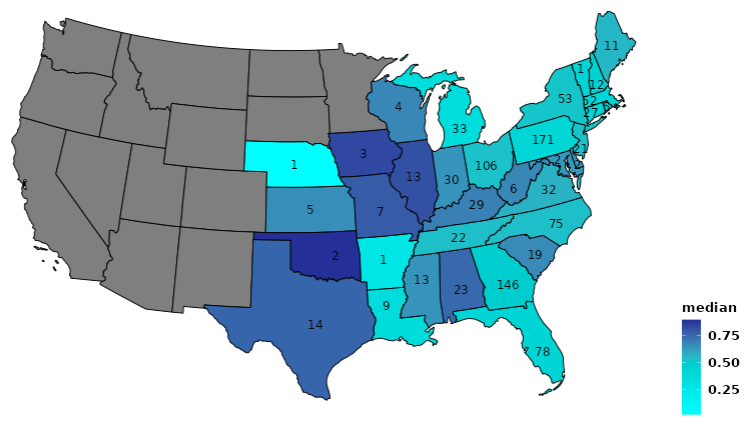
Uncover Hidden Profits
Through data analysis, one carrier discovered that high New England delivery rates did not translate to high weekly net revenue . . . except in one scenario!
Watch Video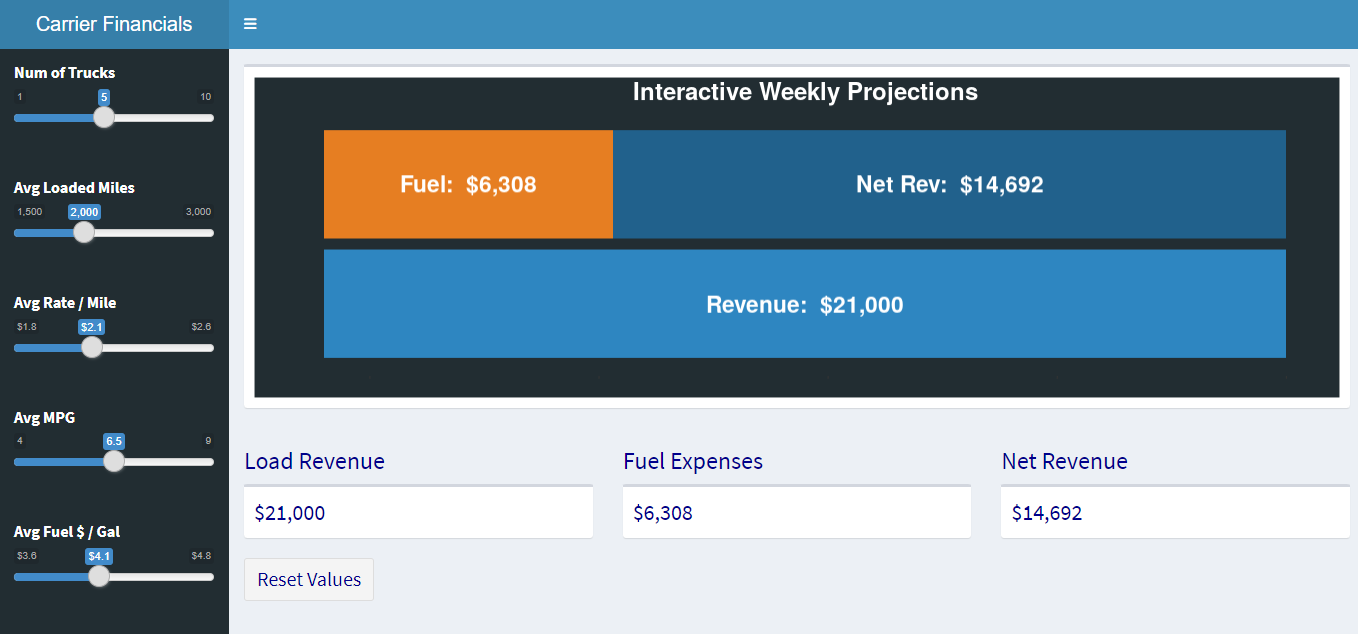
Interactive Carrier Financial Projections
Interactive projections of load and fuel variables reveals that small changes can yield big differences in carrier's weekly net revenues.
Load Dashboard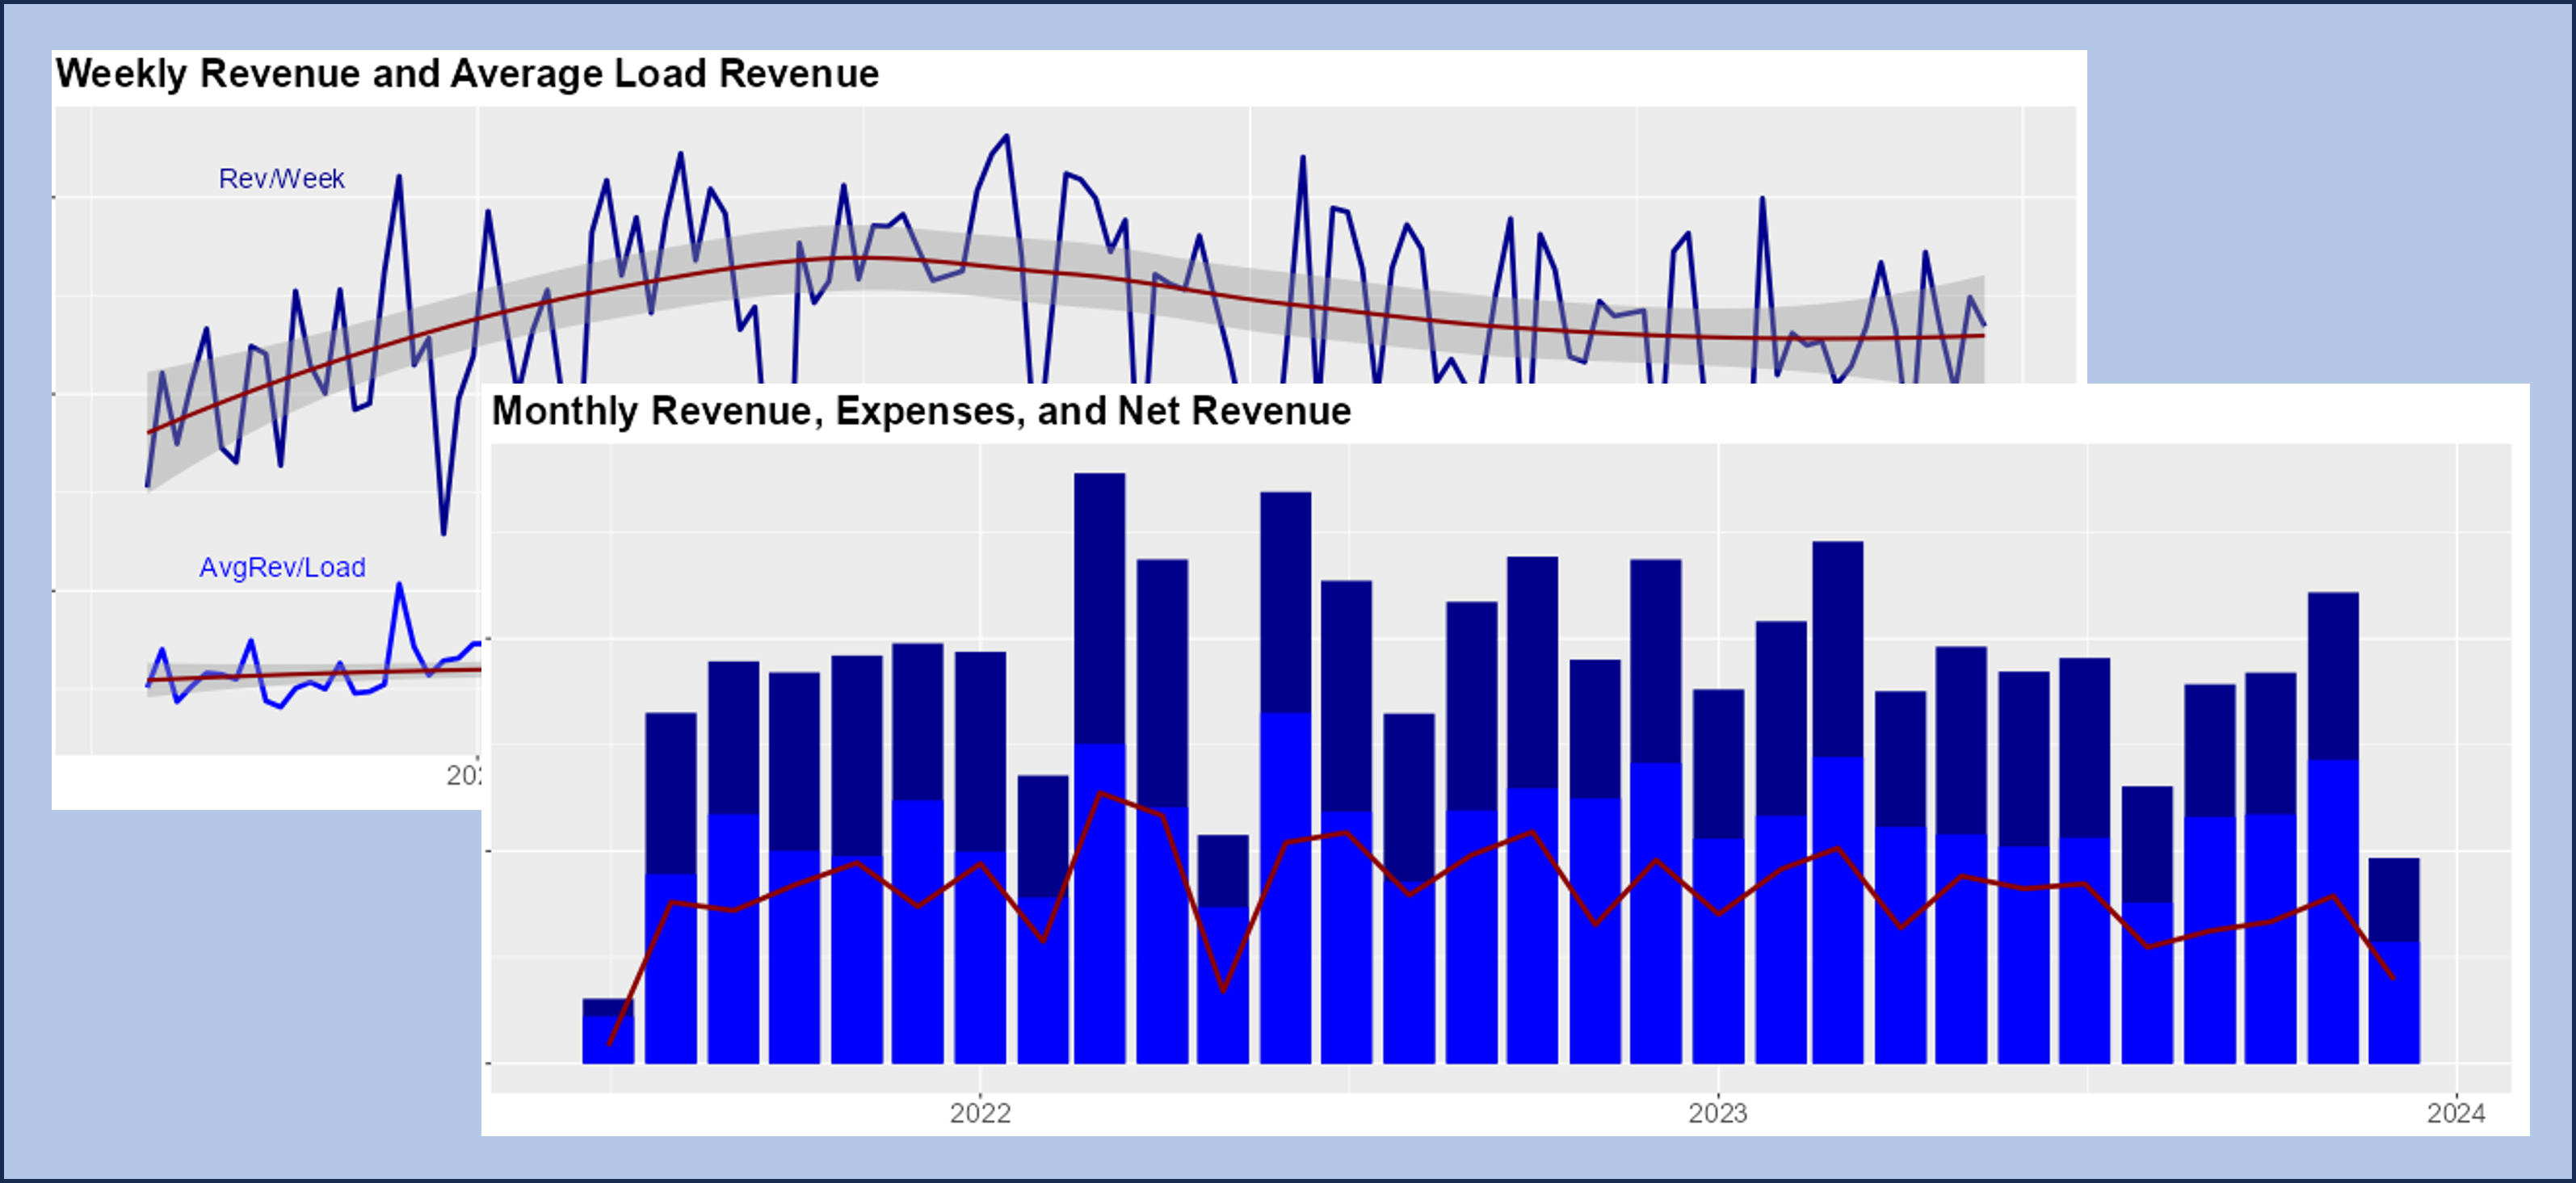
Loads and Lanes Analysis
Interactive dashboard analyzing load revenue, net revenue, and lane profitability. Revealed carrier's most frequent lanes were not its most profitable lanes.
Load Dashboard© Tanjentz, LLC. Marietta, GA. All Rights Reserved. Designed by HTML Codex